Refract UI — Visualizer
Standalone web app for exploring Refract observation data. Load any JSONL file of Refract events and see timelines, word-level diffs, citation graphs, and event-type breakdowns. No backend, no server, no data leaves your machine.
Quick start
git clone https://github.com/refract-org/refract-ui
cd refract-ui
bun install
bun run dev
Open http://localhost:5173. Sample data loads immediately. Drag your own .jsonl file onto the upload zone to inspect it.
Generate data to visualize
refract analyze "Bitcoin" --depth forensic --format ndjson > bitcoin-events.jsonl
Use --depth forensic for the full 26 event types.
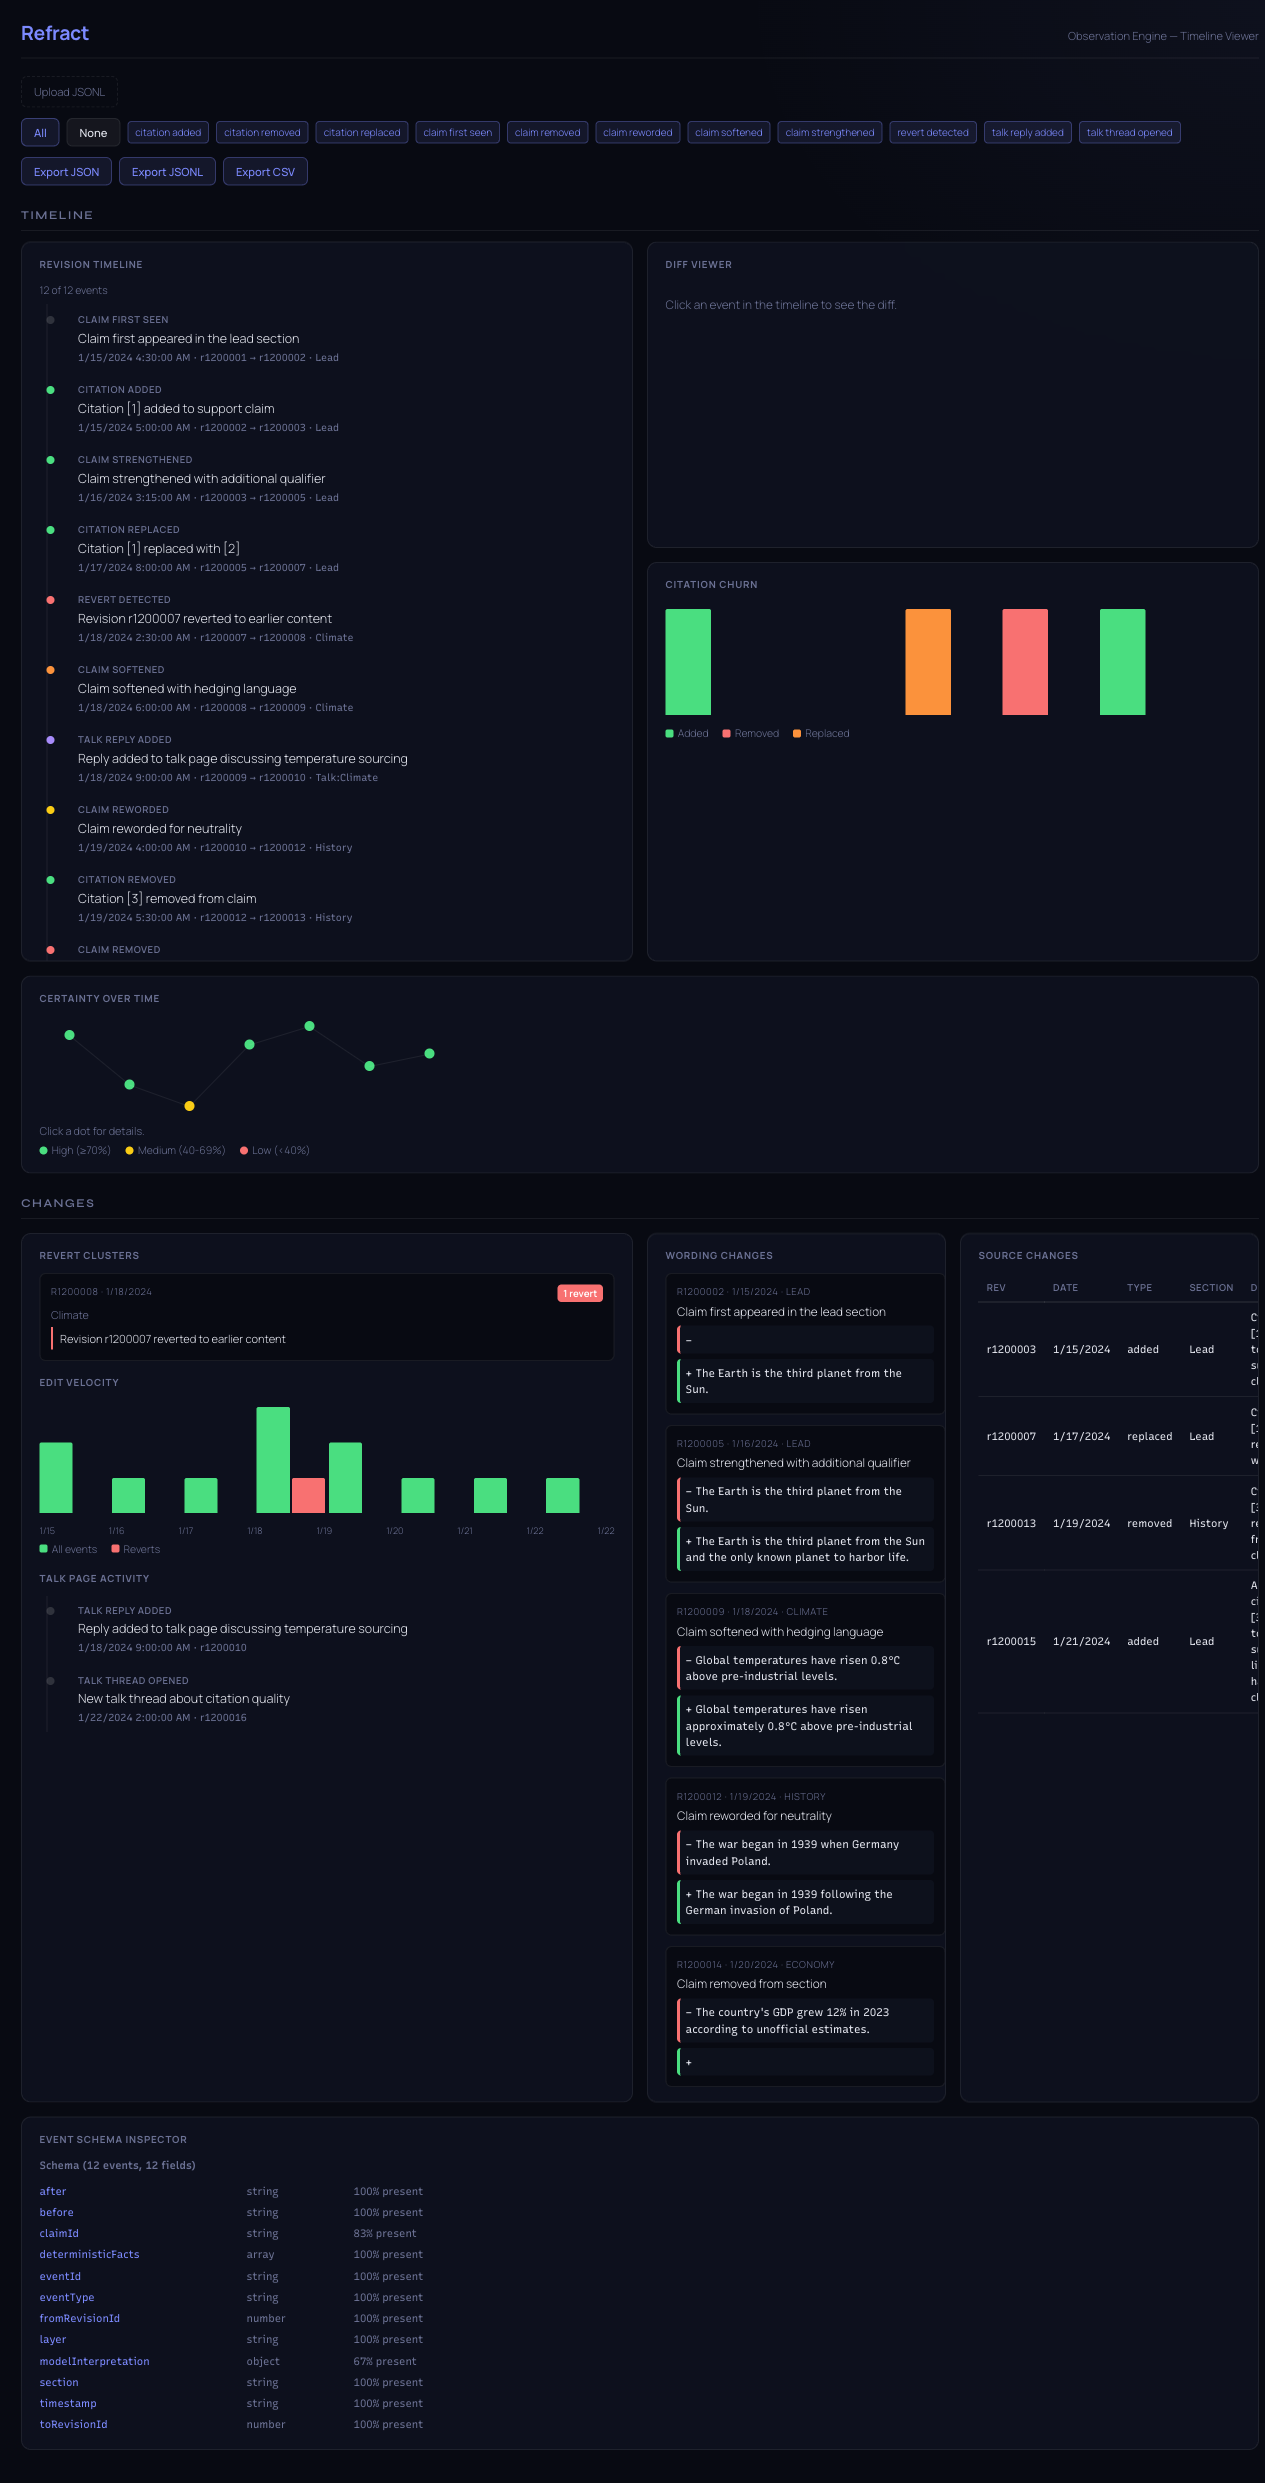
Panels
Timeline
Every event in chronological order. Click any event to see the diff. Filter by event type with the tag buttons in the toolbar.
Diff Viewer
Word-level diff of before → after for the selected event. Removed text is shown struck-through in red, added text in green.
Citation Churn
Bar chart of citation additions, removals, and replacements per revision, plus a sortable table of every citation change.
Certainty Timeline
Confidence scores over time for model-interpreted events. Dots are color-coded: green (≥70%), yellow (40–69%), red (<40%).
Disputes
Revert clusters, edit velocity per day, and talk page activity timeline.
Language Changes
Card grid of wording events — claims reworded, strengthened, softened, or removed.
Schema Inspector
Every JSON key in the loaded data with inferred types and presence percentage.
Export
Download filtered data as JSON, JSONL, or CSV using the toolbar buttons. Filters apply to exports — narrow by event type first, then export.